Author: domgk115 115

  • Who knew straight lines were hard….

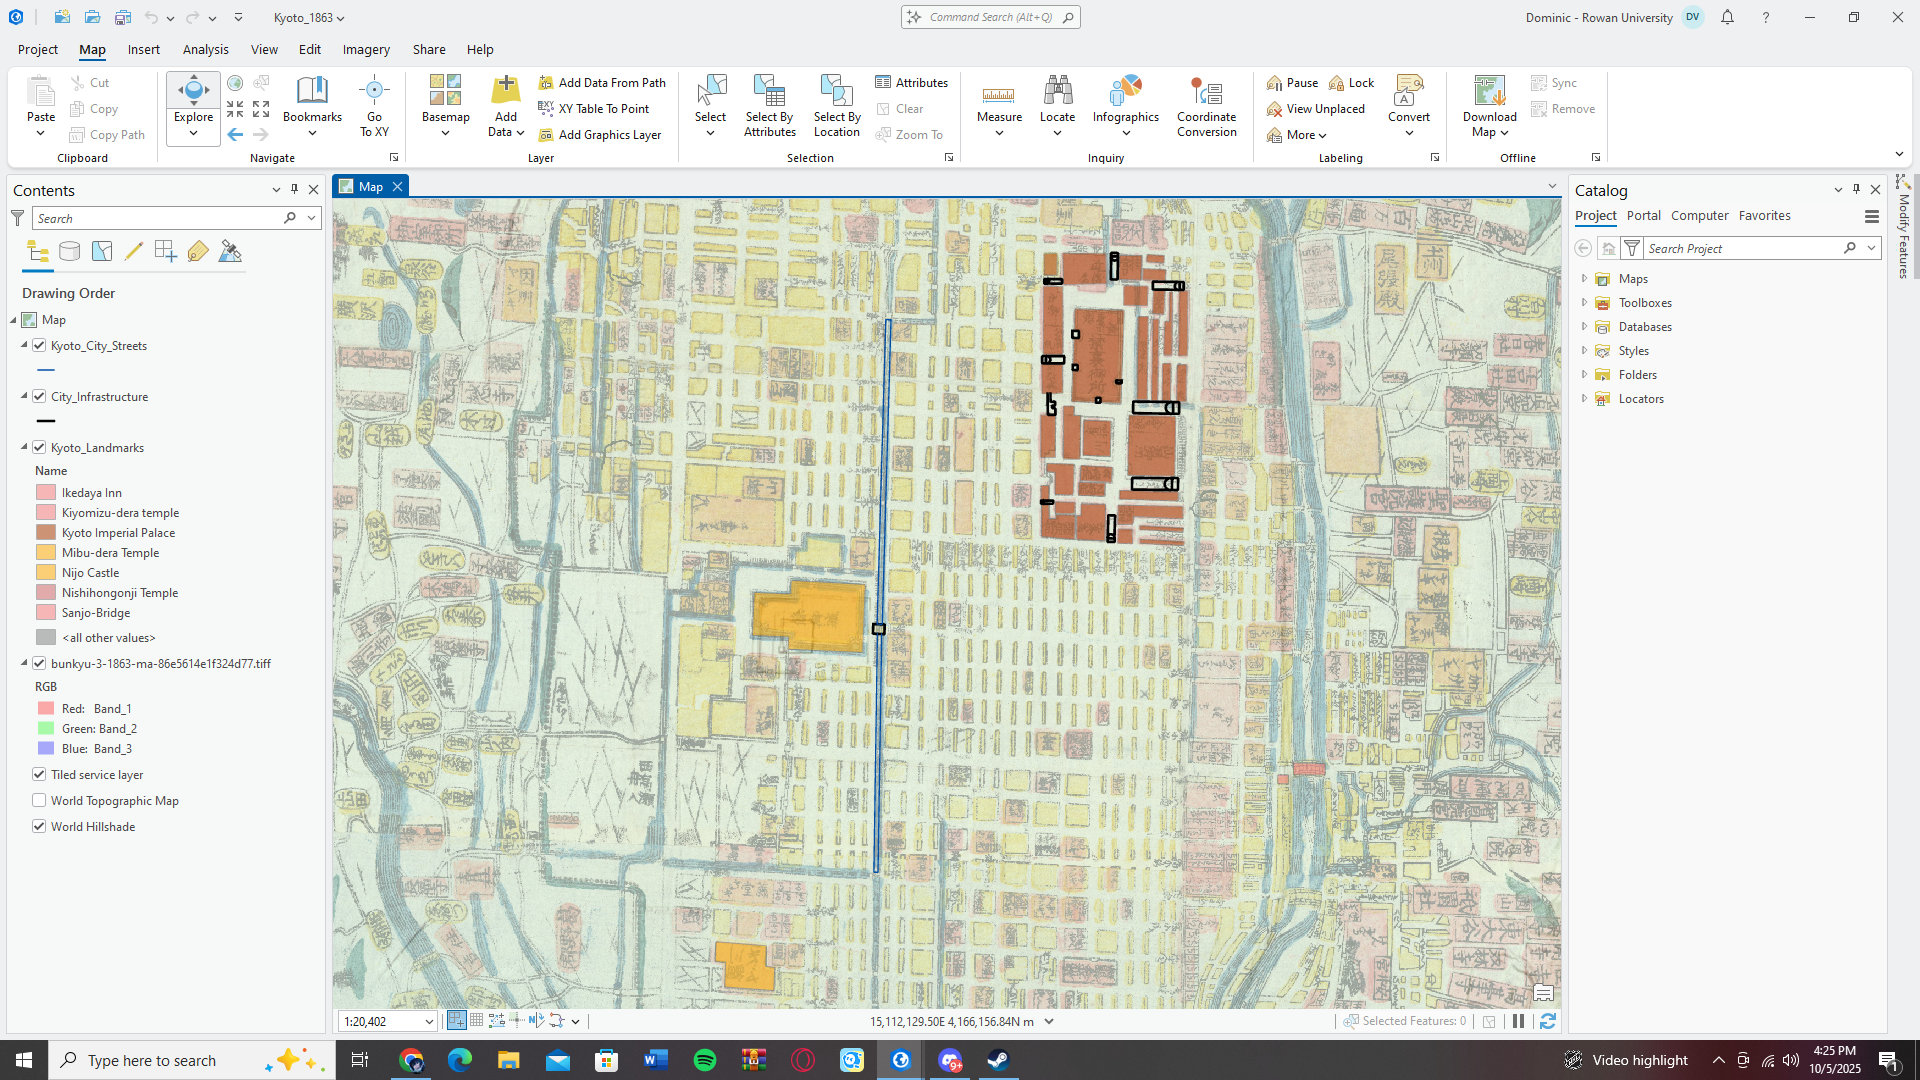
    When I first started learning the ArcPro tools, one of the best things about it was one simple fact. It draws lines for me and they are always straight. I can angle them myself of course, to make them face certain directions, but all I have to do is place two control points and the line will connect without me having to draw the line between them. So, when it came to drawing the first of Kyoto’s major streets I thought initially it would be easy, however the most difficult parts are aligning the straight lines with the map that I’m using for reference. For context the map I’m using is hand painted, so the streets and buildings themselves are not all completely straight and the same length. So, as a result some of the street lines and tracings of buildings aren’t exactly one for one with my reference map.
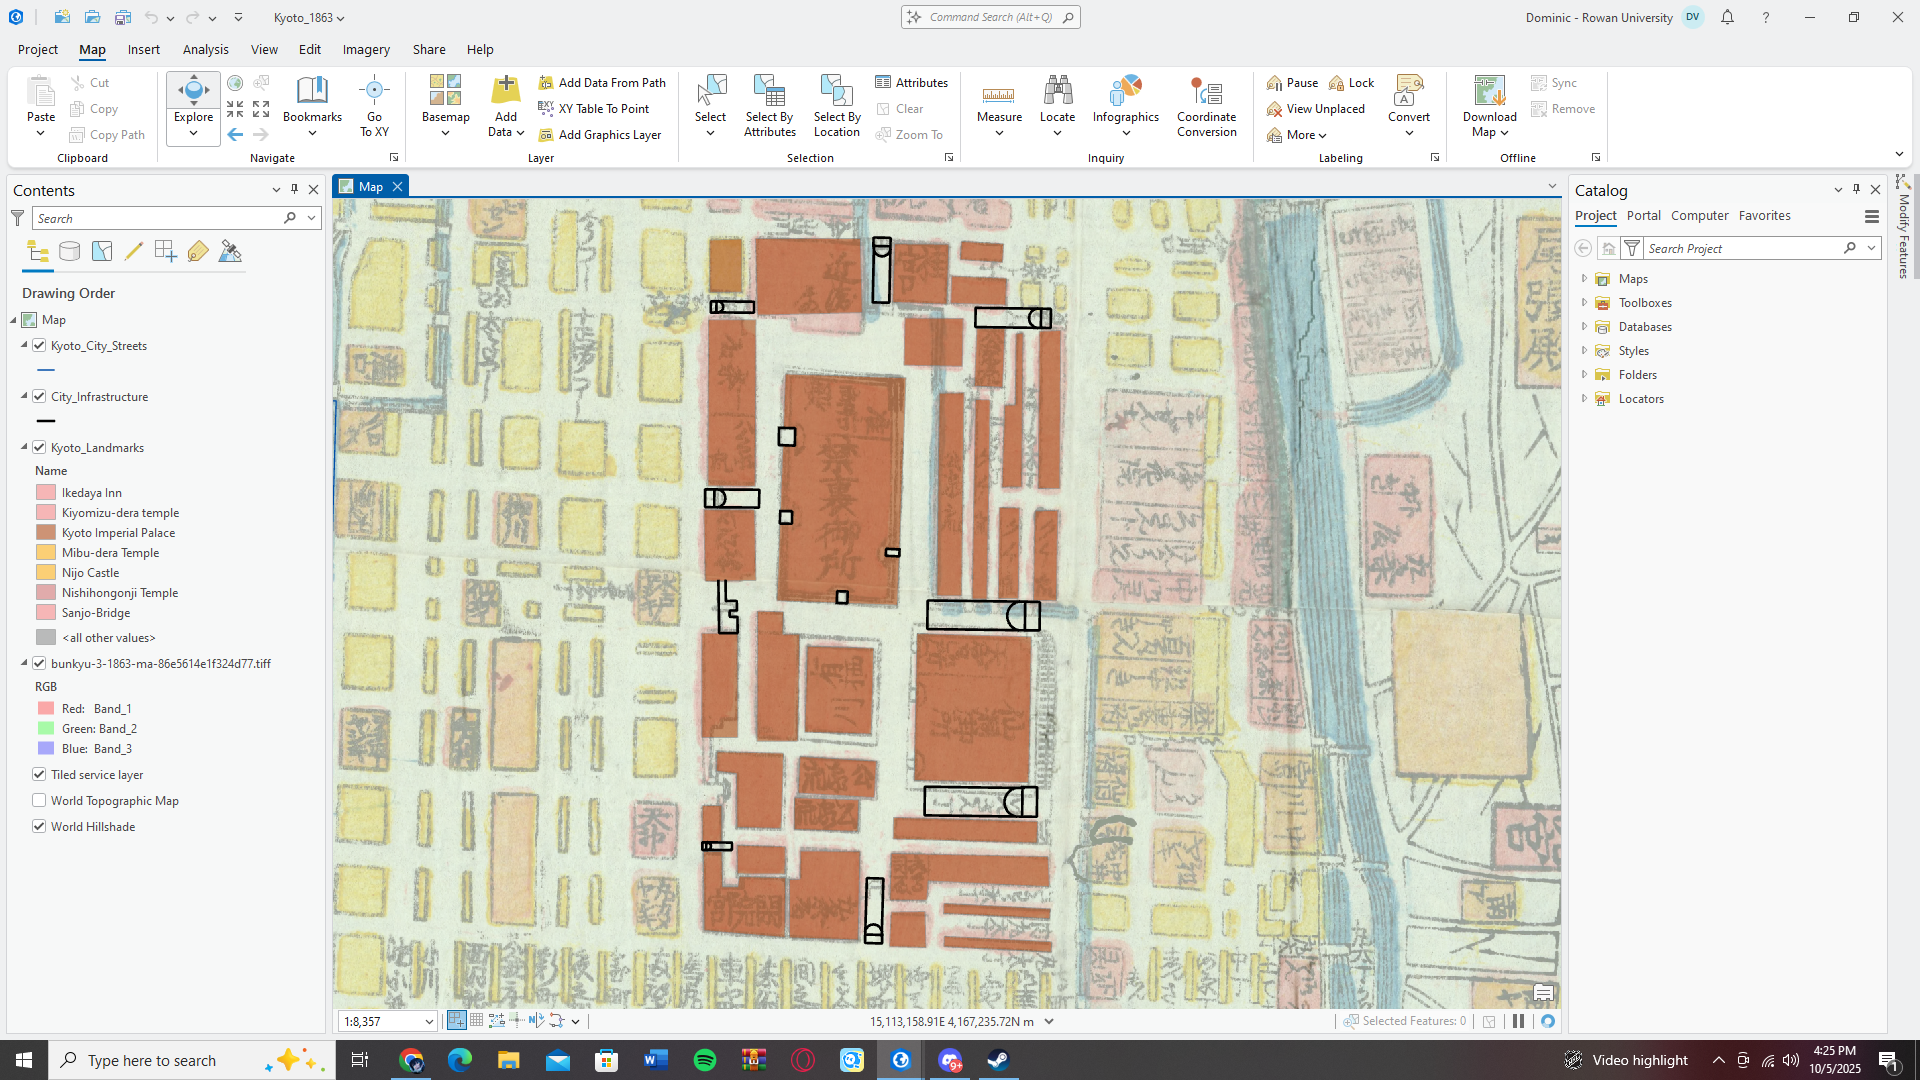
    The second ‘line difficulty’ this week, was when I started tracing the different gates of the Kyoto Imperial Palace compound. The palace compound which by the year 1863 had served as the home of the Imperial Family for over a thousand years had a series of gates surrounding not just the larger compound but the inner palace itself. Many of the gates were the subject of rebellions, fights and fires, the most famous being the ‘Kinmon Incident’ or the ‘Hamaguri Gate Rebllion’, where an army of three thousand men from the Choshu domain attempted to defeat the Tokugawa forces in the Imperial Palace. They intended to kidnap the Emperor away from the Tokugawa forces who they believed were corrupting him and wanted to return him to full power. In the process, they burned dozens of surrounding houses despite being soundly defeated. So, this event is going to be recorded in my story map, making the Hamaguri Gate something I have to include. Thankfully, Dr. Saladin has shown me how to copy and move over the different polygons and line tracings I draw, so I only have to draw them correctly one time.
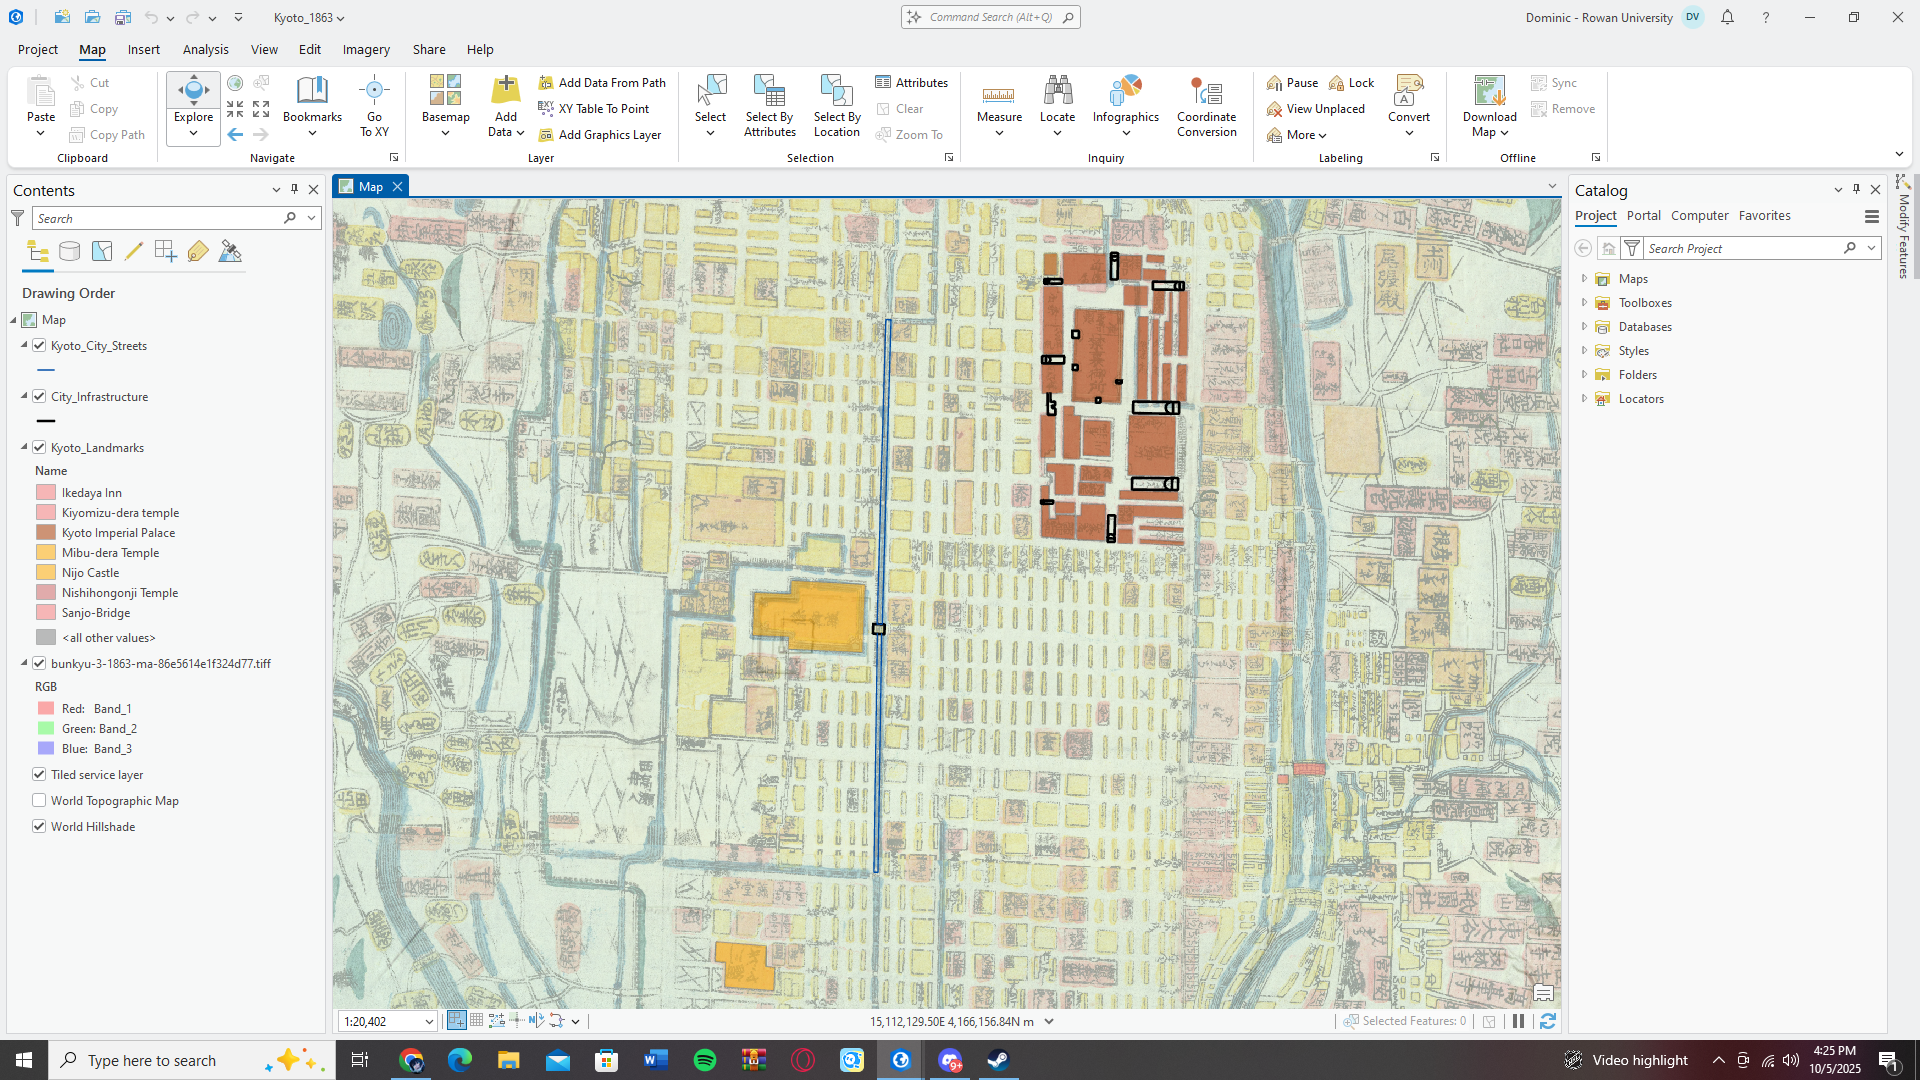
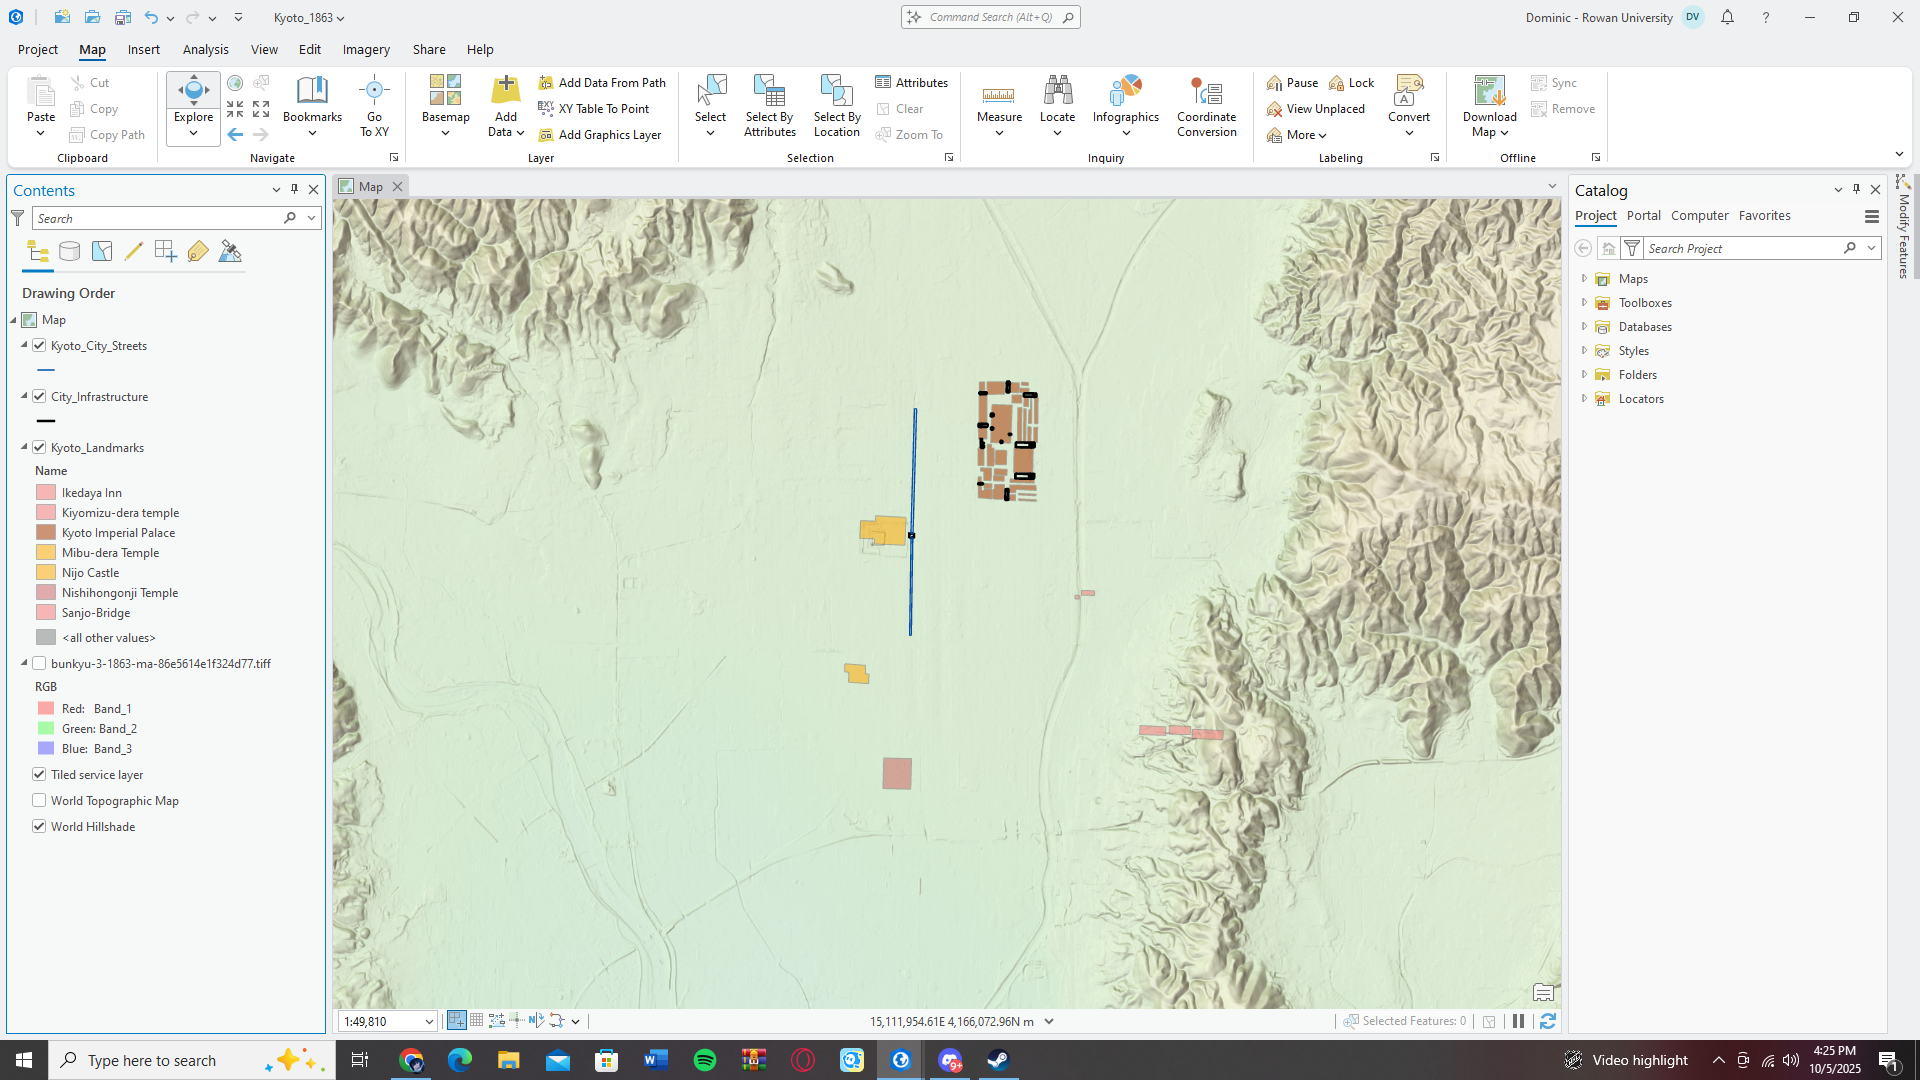
    Thankfully the only streets I’ll have to draw are the long major roads. The rest of the smaller side streets are going to naturally be filled in when I start tracing the smaller buildings. Everything on the outside of the two rivers surrounding the city I believe I’m going to leave out unless I discover there is an incident there I want to record. So, by the time my desired deadline for finishing my tracing comes next week, I believe I’ll have it done, and I can get on to the Story Map and spreadsheet of the different incidents which is what I am most excited for. So, straight lines will only hamper me for a little bit longer.
    On a more personal note that also has to do with Digital Humanities, I’m in the interview process with the National Constitution Center in Philadelphia. The position is a near full time (30-32 hours a week) position, as a Museum Educator, and during my initial interview when I mentioned I was in the middle of a Digital Humanities COGS, my interviewer was interested and when I described to her my capstone and other projects, she told me she-just like me for this project- has used Dave Rumsey’s georeferenced historical maps for her projects before. She said there was and could be plenty of opportunities to assist the exhibits and education department in different digital projects. I think this was a large part of the reason I believe I was able to get my second interview, I should know by class on Monday October 6th how well everything is going to go. This could be the start of a real career which is always exciting!

    And it’s in part thanks to digital Kyoto!
  • Polygons? In my History class?!

    I have a recurring inside joke with my old roommate and friend group. A year or two ago, I came to trivia night and heard them having a mind-boggling conversation about vectors and vertices. Me being the funny person I am, made fun of them for talking about lines when they’re computer science majors. They responded appropriately, calling me a nerd, and insisting that one day even I’m going to be working with vectors even if I’m a history MA student. Every since whenever lines or vectors come up I get sufficiently teased, and now my worst nightmare has come true. All I’ve been doing is adjusting vector layers and vertices when tracing/drawing my map of Kyoto, I don’t expect the jokes to stop for some time, but I dug my own grave.

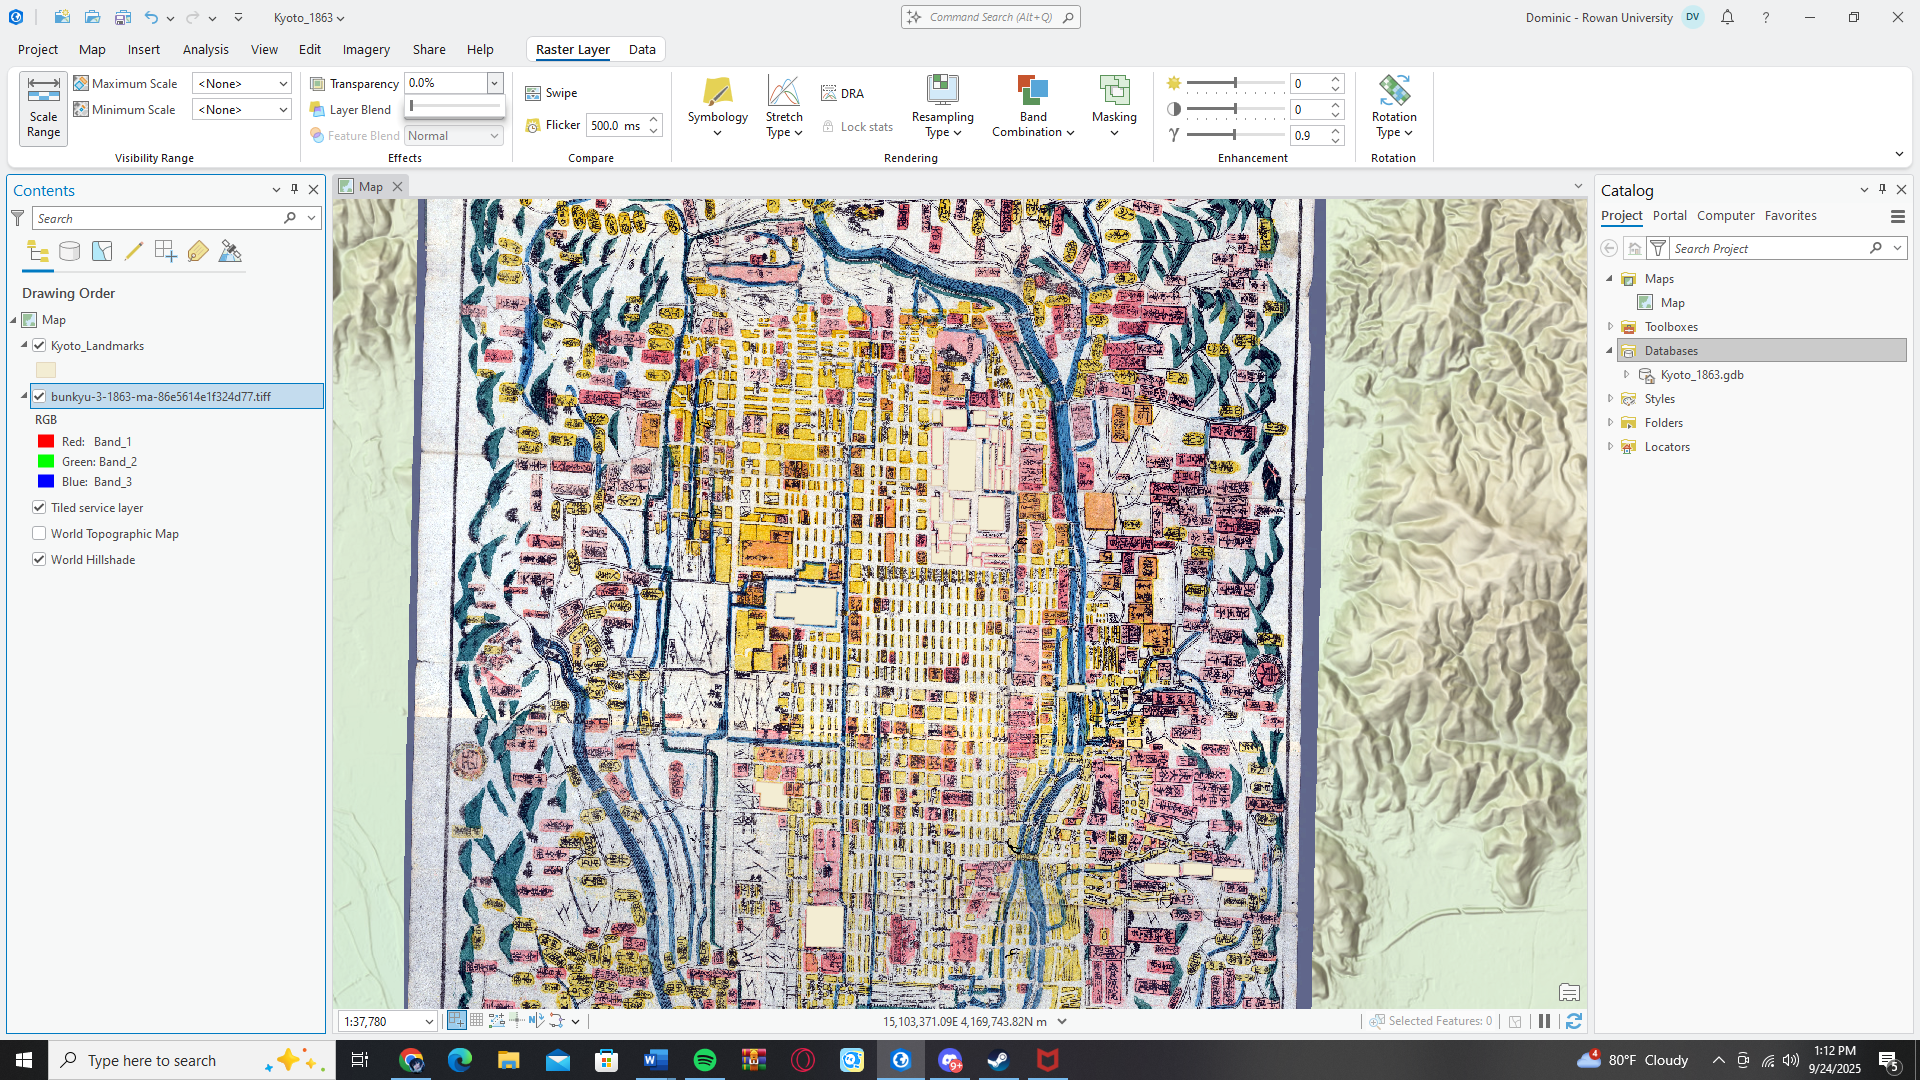
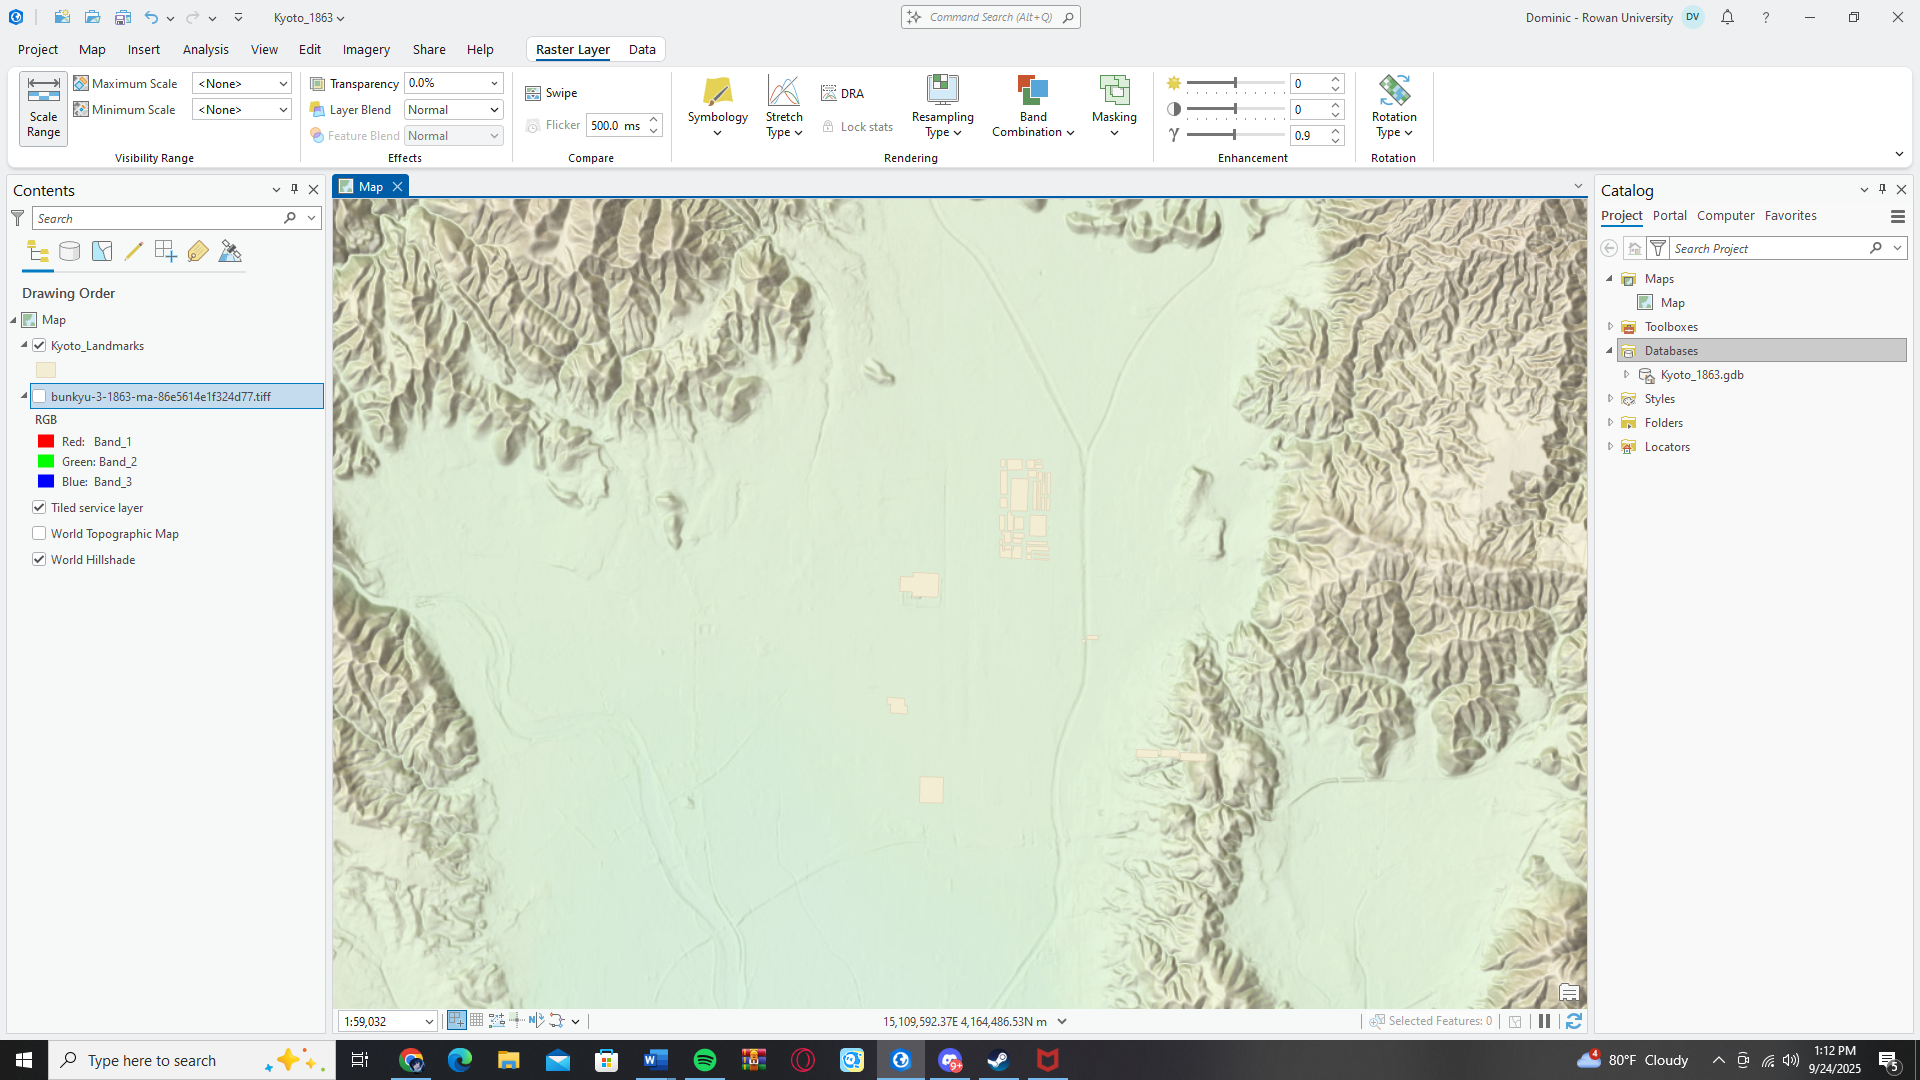
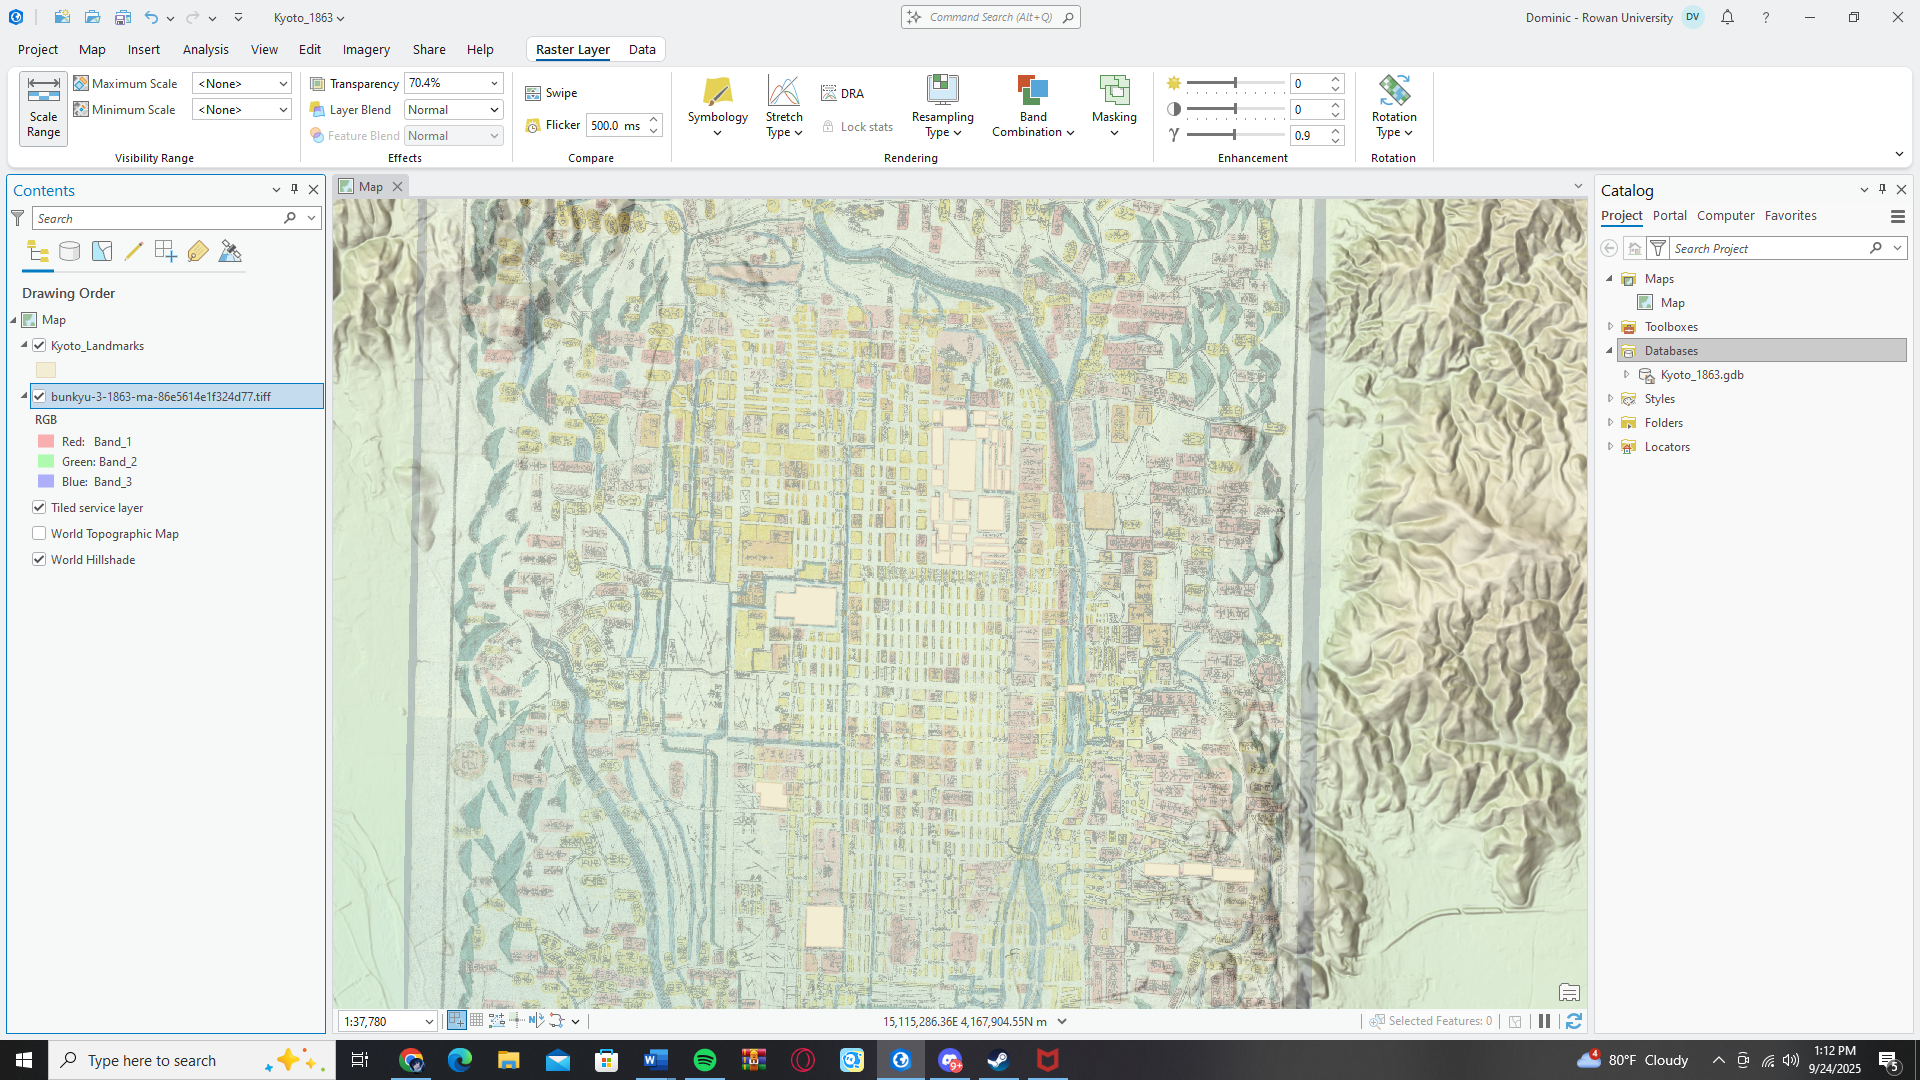
    After struggling for a week, I am finally into the swing of things. All the tools are finally beginning to make sense, and most importantly I finally have a georeferenced map thanks to the ever reliable Dave Rumsey and his massive map collection. Essentially, my base is an old woodblock painting titled ‘Bunkyu 3’, (Bunkyu was the Japanese name for the time period, 1863 was the ‘Third year of Bunkyu’ on the Japanese calendar). Painted by an anonymous painter, it was a recreation of the city of Kyoto in 1863, which is right in the middle of my desire period of 1862-1868, the height of Bakumatsu Period violence. The next step naturally would have been georeferencing, selecting control points on the old map and then the same spots in modern day Kyoto to situate the map. However, Dave Rumsey came in clutch again. I was able to download his control points and load them in as well, which means I was able to jump right into tracing.

    Then, we came to my second decision. Essentially I need three layers, a layer for the major landmarks of Kyoto, a layer for the regular residential buildings, and finally a layer which outlines the major streets, although I may be able to exclude this one depending on how it turns out after tracing buildings. I may need to draw a layer for the Kamo River which snakes around the east of the city. It seems like a lot of drawing, but I won’t need really any buildings outside the main city center. I am lucky as Kyoto lays in a natural valley surrounded by mountains so it doesn’t sprawl out as far as somewhere like Tokyo. Also another really great thing, is of all the cities in Japan, Kyoto has remained one of the most unchanged in the last hundred years. It was mostly spared in World War 2, so original buildings still stand, and street names mostly remain the same.

    Now, it may seem like tracing all of those buildings will be time consuming, however, with certain controls in ArcPro I believe I can get it done with a week or two of consistent work. After that, will come the labeling which may end up taking just as long, but I’m well on my way to being finished by I’d say mid-October which could even be a week or two before I planned. After that, I can get right onto plotting the points and filling out my spreadsheet for them. However, this would not have moved as fast if not for this beautiful original map of Kyoto from 1863, it really became my savior. I’m well on my way now! Although I will say, drawing polygons over and over and over, adjusting vectors and vertices, is NOT how I imagined my final major project of graduate school….

    Dom’s Bakumatsu period fun fact: The small rectangular yellow square you see on the map to the right are called ‘cho‘, and they are the residential buildings in old Japanese cities. They were essentially apartments and a lot of them doubled as businesses as well. You can also see by looking at the map there is only a few major streets. The long blue line going down the center of the city isn’t a river, it’s one the main road of the city. (Why it was painted blue we’ll never know). But this was a common design in Japanese cities, since large wide precessions of soldiers and households often came through the cities, so when a massive palanquin and hundreds of soldiers were coming through town you needed space. It was also deliberate in an attempt to distinguish different districts of the city. You’d find major markets and restaurants on the road, but the result of these larger roads meant the smaller alleys and streets between the cho were easy to hide away in. This is the reason so many Imperial Loyalists and Shogunate Loyalists were able to hide in the city, and why things like skirmishes and assassinations were so common, since it was incredibly easy to make your escape.

  • I’m Finally at the starting gate

    After a week of struggling, a meeting with Dr. Saladin, and a closer look at some of the tutorials have got me to a point where I believe I can actually begin the basemap now. I don’t have the sources to create my own basemap of Kyoto and the street grid from scratch, however, what I’m going to do is take a few of the maps from ArcOnline and mesh them together, to get one ‘master map’ from all of them. After that, is when I’ll begin changing the symbology and then trace the inside of any structures I may have access to. However, simply getting the map down is what is most important now. After that, plotting the points of incidents/skirmishes should be relatively easy.

    As for the points themselves, I plan on having 15-20 of them. That may not seem like a lot for an entire city. However, adding more is something I see as a ‘post capstone’ project, where I can research and read about more important incidents I want to include in the map. I’ll make up for the smaller amount of points, by having a good amount of information about them, and going into much more detail in the Story Map. Now that I have the skills for ArcPro down, I really do believe getting the map down will only take me a week or two, before I can move onto the points and plotting them.

    Finally, as I write the project charter, I’ve finally decided on a title. “Kyoto in Chaos: The Bakumatsu”. For a small bit of historical context, the Bakumtasu Period, was from 1853-1868, and can best be described as a ‘Civil/Cold War’, between the ruling Tokugawa Shogunate, who’d ruled Japan since 1600, and the ‘Shishi’ and ‘Sonno-Joi’ movement, these groups of men wanted to overthrow the Tokugawa, and restore the Emperor of Japan to power. In reality, it was the nobles on the rebel side that wanted to have control with their Emperor as their figure head, however, the main point of contention was the arrival of the United States and Europe on Japanese shores. The Tokugawa signed unequal treaties allowing the foreigners into Japan, and the rebel side was furious. As the years went on, both sides ended up allying with the United States and Europe against the other, however, that wasn’t until open civil war called The Boshiin War in 1869.

    In the 15 years of the Bakumatsu period, however, both sides were secretly at war, in the ancient capital city of Kyoto. Both sides made the ancient holy city their battleground with violence spiking specifically between 1862-1868, with famous figures like Sakamoto Ryoma, Okada Izo, Hijikata Tozhizo and Okita Souji all making appearances. Assassinations, vandalism, arson, torture of prisoners, extortion and bribery, even outright rebellion were rampant. Kyoto was the home of the Emperor, and while Edo (soon to be Tokyo) was the main hub, Kyoto was the cultural and spiritual center of the country. In my recent trip there in May, however, the sites of many of these incidents still stand, and are tourist attractions, the samurai in the city during the period which brought terror to the streets including the famous secret police force-The Shinsengumi-are cultural icons plastered all over the city. So, with this information in mind, the main goal for the map, is going to be figuring out what led to this. What effects did the chaos of the Bakumatsu Period have on the city of Kyoto, and how has it lead to the cities cultural development?

  • The maps are an absolute mess in week 1!

    Nothing reminds me that the semester is back on quite like staring at my computer screen and being baffled by maps for hours each day. I have quite the hard time making head or tail of ArcPro, even with the tutorials I’ve been following there are so many more steps then I was expecting that it’s been as frustrating as it was during my first weeks of the internship. ArcOnline was just as confusing in the first week that I used it last year during my internship, but Pro simply has so many more features and much more intricate details. One small number or box not being ticked seriously can throw your map for a loop, and it’s difficult to troubleshoot, since the troubleshooting requires you to normally be well familiar with the controls in order to solve the problems.

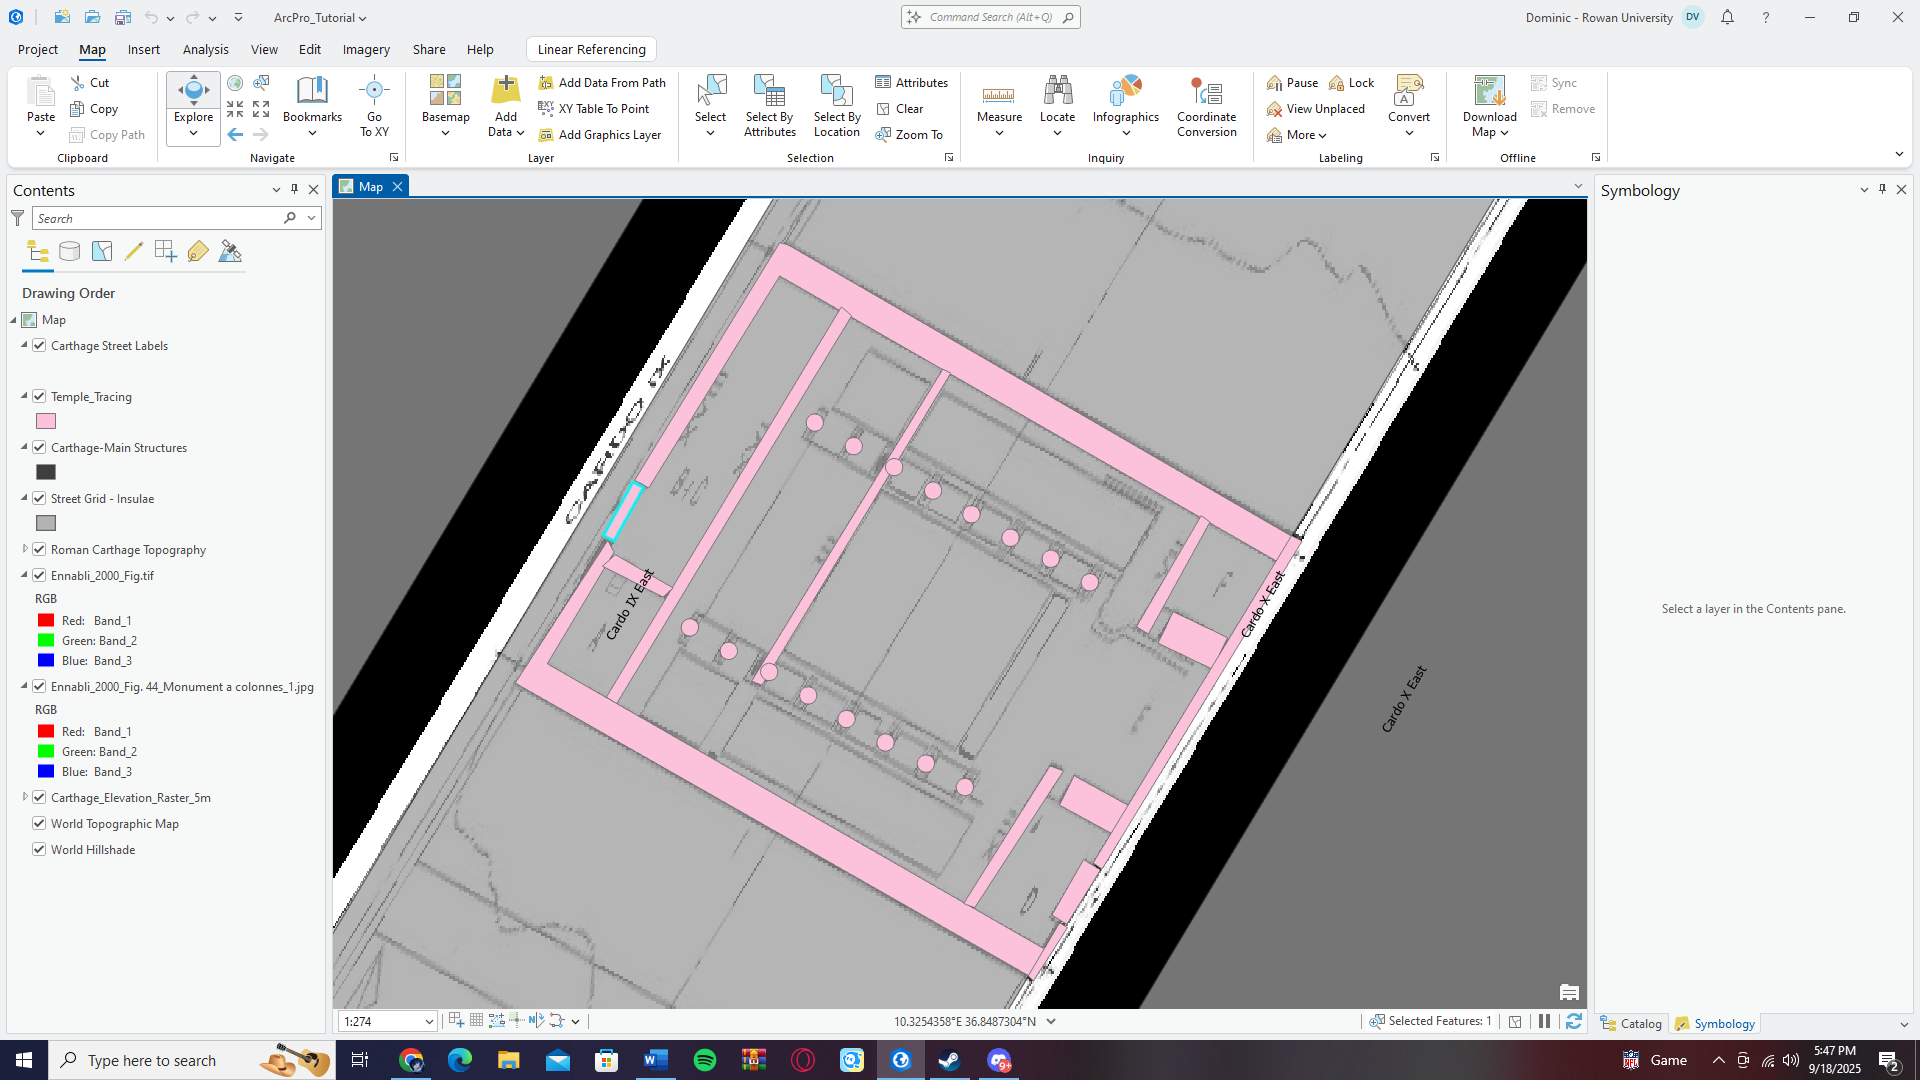
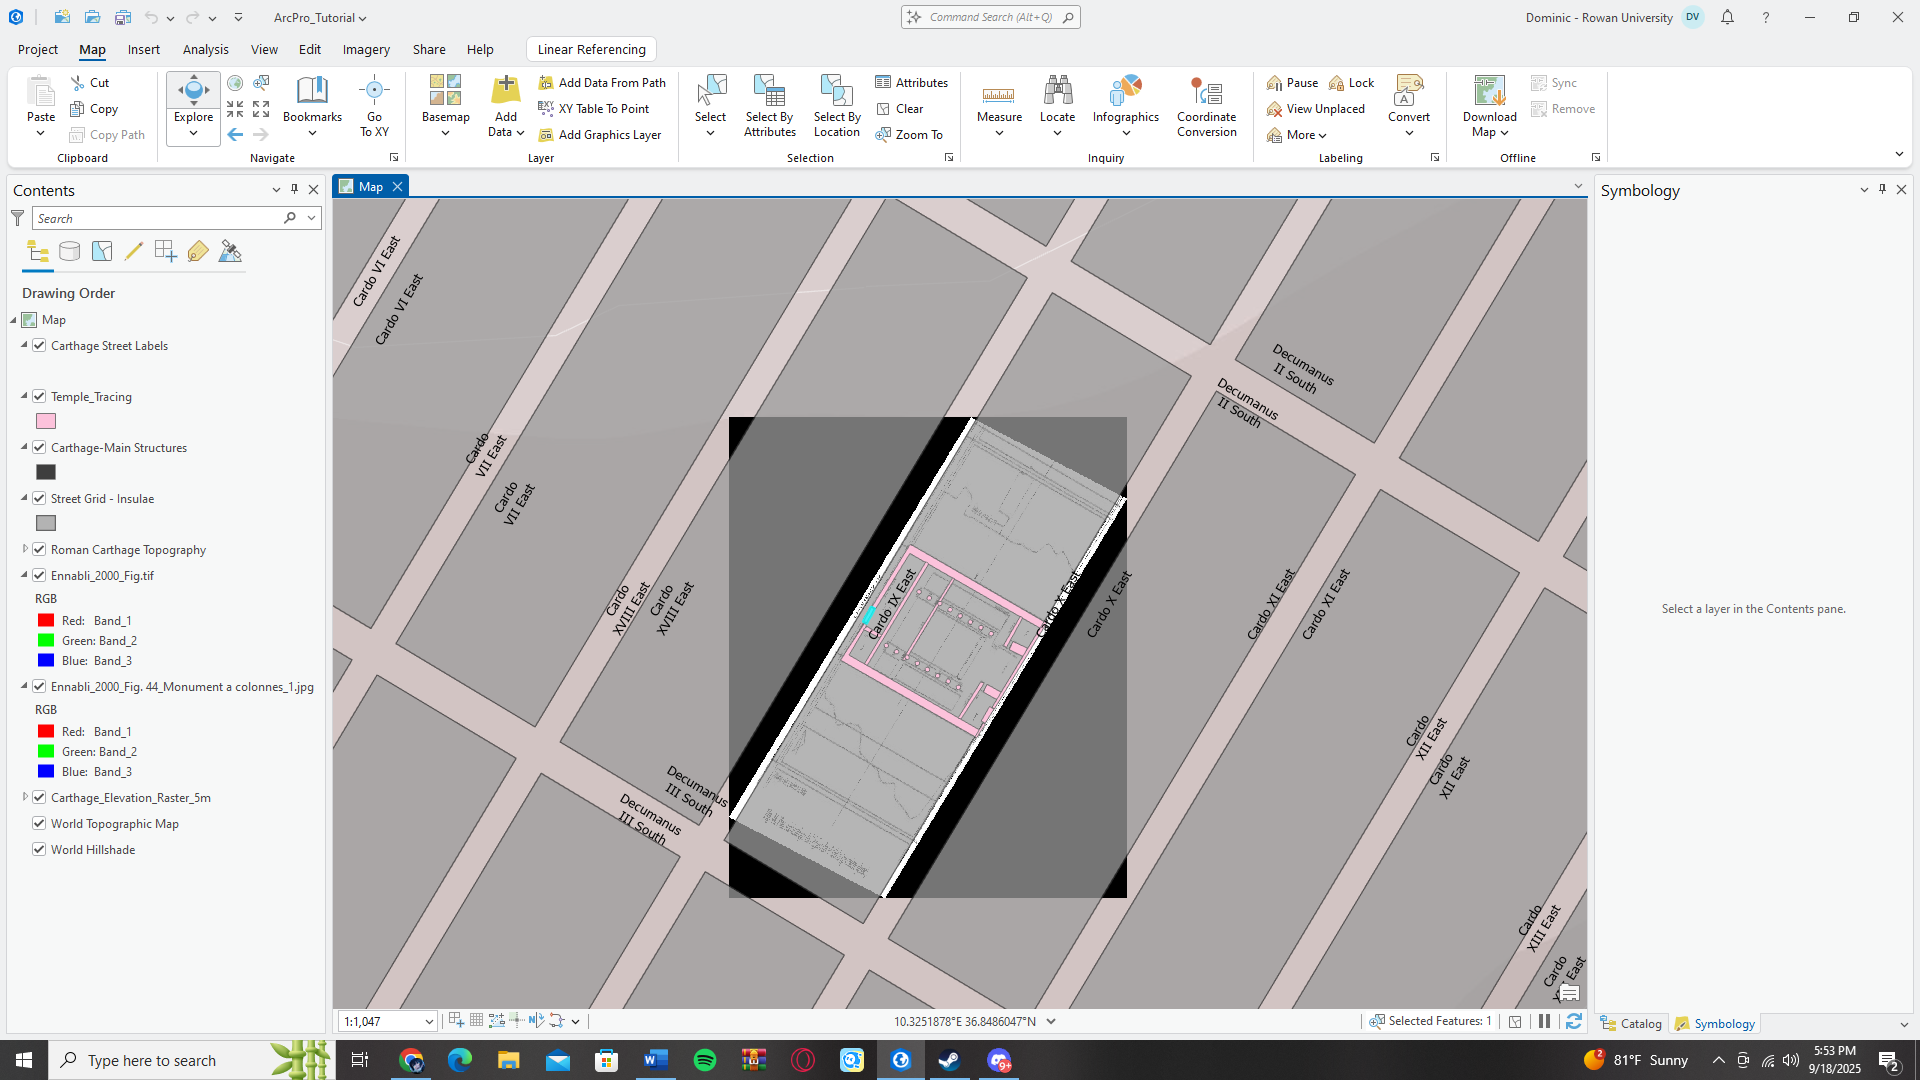
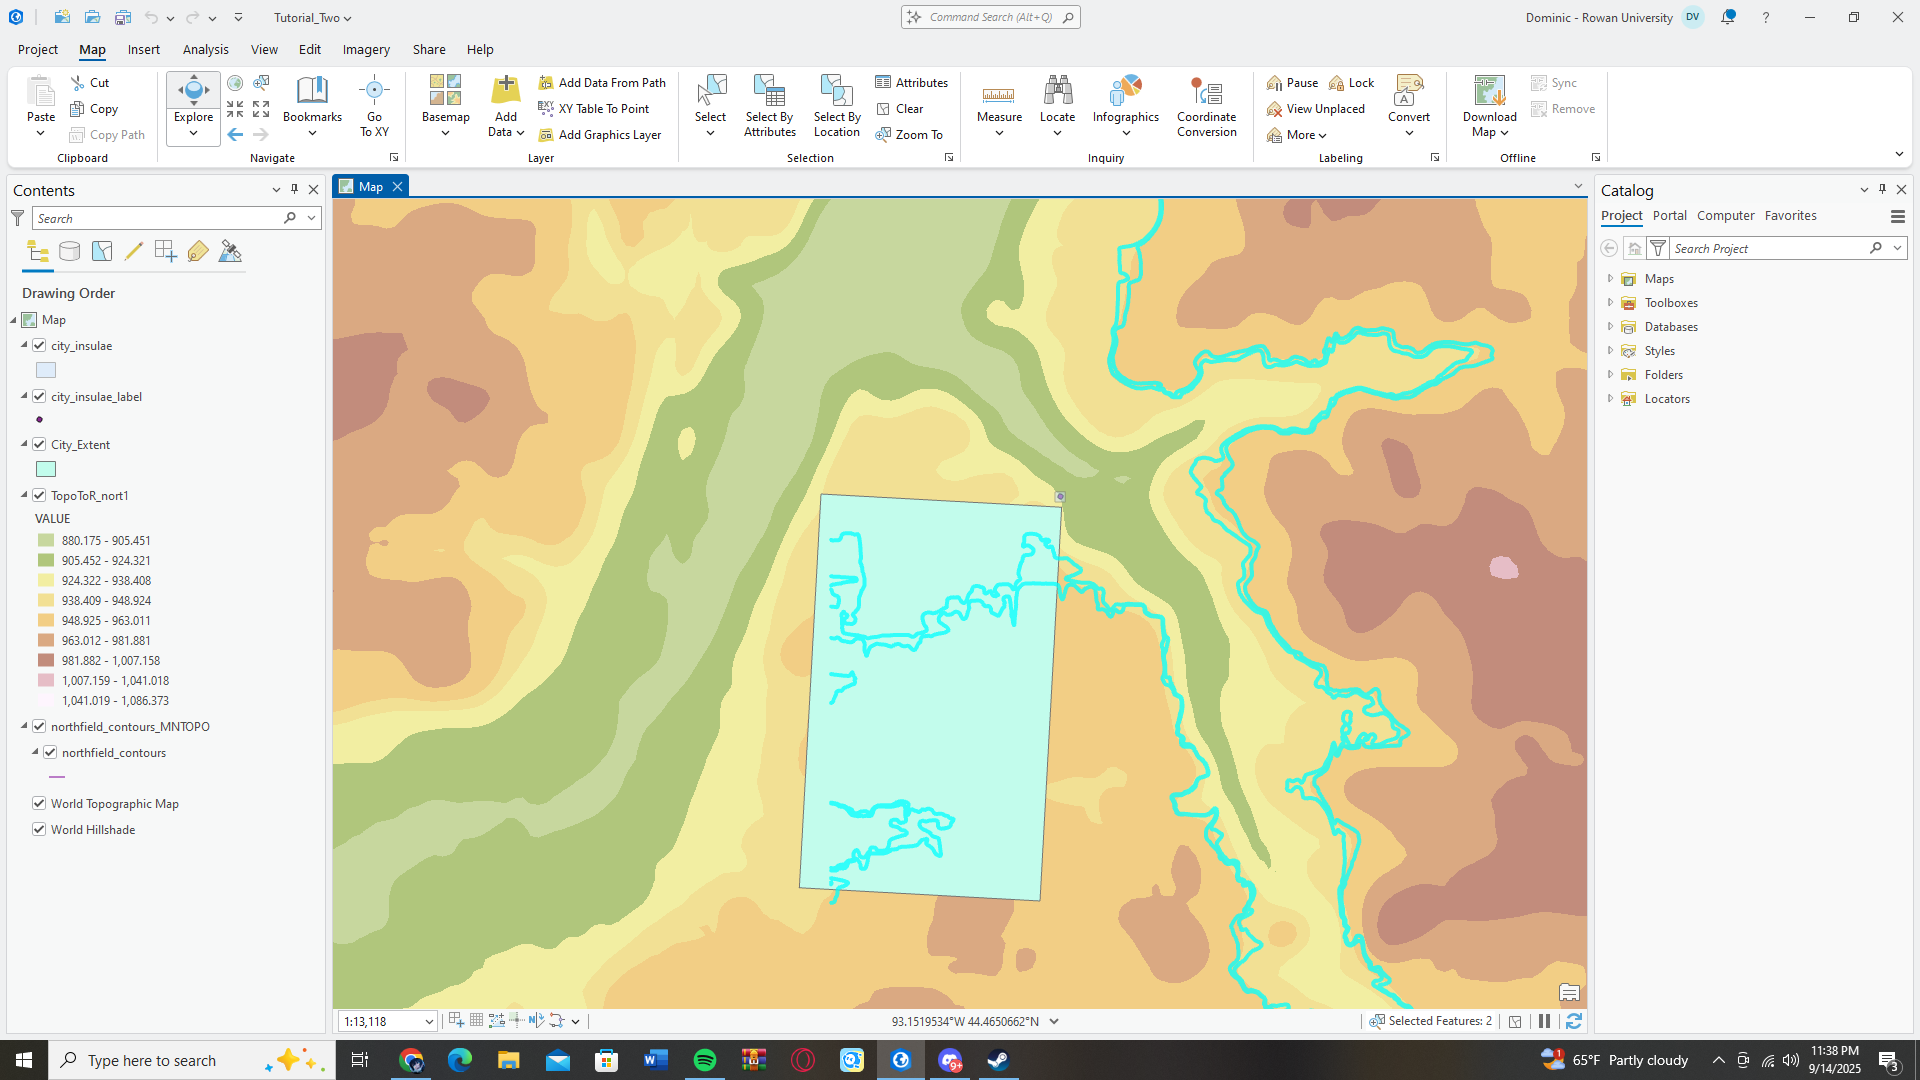
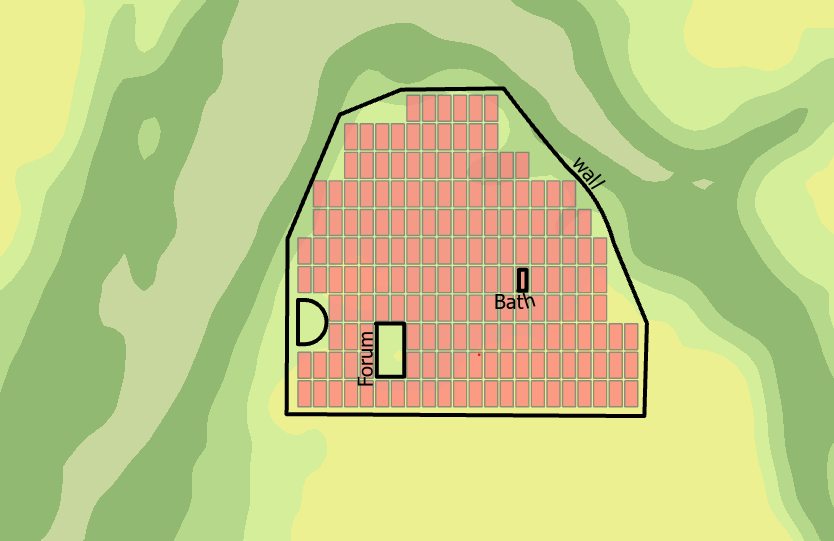
    Seriously, if you look between my own map I’ve created in the tutorial (Top right), to what it’s supposed to be at the final product (Bottom right) the difference is night and day. Of course I’m not finished going through the main tutorial yet. However, I’m starting to have a hard time seeing how it will turn out like the example. It makes it a bit frustrating to not see the natural progression to what it’s supposed to be. However, this could also just be me being impatient. I believe I’m going to go back through the tutorial again and see if I miskicked anything or put something in a wrong field, however, I do think this is going to affect how I go forward for not just my job with Dr. Saladin, but for my capstone as well.

    Creating my own gridded map of Kyoto for it seems like it would take a bit longer then anticipated, but I believe there has to be one already created out there I can plug in as a basemap. The only challenge will be making sure it lines up with the proper time period that I’m aiming to go for. Downloading a basemap straight from the Arc database will probably be what I end up doing simply to save time. However, I anticipate I still have a week or two before I really get going on the Kyoto basemap itself.

  • And it all comes to an end.

    Three months can truly go by in the link of an eye and that is what happened this spring semester. My last one as an undergrad, I really expected it to feel like a bit of a slog considering that it was my last one, but no, I blinked and I feel like three months passed by in a flash. However, sitting down and looking at my completed projects , I really have been reflecting on just how much work I’ve done this semester between my internship and other classes. When I first got my deliverables at the beginning of the semester, I thought that a map of Roman North Africa was all I’d work on. However, three months later I’ve not only completed a map, but an in depth Story Map as well. I’m incredible satisfied first with how the map turned out, I remember when I was first figuring out the GIS tools, that I’d need to have my hand held for a while, but despite it taking me quite a while to finally grasp all the tools, I was able to move quickly and now, I have my first map. This is going to be fundamental in what my future capstone project is going to be.

    https://rowanuniversity.maps.arcgis.com/apps/mapviewer/index.html?webmap=c98c7aaced084b5db2dfac236a59343c

    After the map, it was time for the Arc Story Map, which I thought would be a lot simpler. However, I found that it was just as much of a challenge with the smaller intimate details like the organization of where the tabs and pictures are added. The first challenge was transitioning back to traditional researching and notetaking after a few months in a row of purely plugging away at the map online. Also I ran into the challenge of ‘trimming down’ all of the information that I found. Going from an entire page of notes down to only a few sentences was hard, since each thing that I cut really felt like it would add important context. However, after going through each of my highlighted cities, I was able to finish my second project of the semester only a few days before my last official moments as a spring intern.

    https://arcg.is/010jGX

    So, now that the semester is all finished, I can’t describe how valuable it was looking back. Not only did the pay help me support myself and gain great resume experience, but that has actually translated over to a real viable job for the summer. I fully believe the boost to my resume that this entire semester provided was what helped me to get my job at Penn for the summer. I know that is going to help me tremendously as well going into what will be my first year as a full time grad student and also my last one in school as a whole. My capstone project is going to probably be the largest undertaking that I’ve ever attempted, so I’m extremely grateful I had the chance to learn this semester what I need to make that project a reality.

  • Story maps and the Penn museum

    I finally started on what should be my final project for my internship, and also found myself a job for the summer, so the last few weeks have certainly been eventful to say the least. With the last few weeks of work in my internship coming up, the first thing I plan on doing other then finishing off what I currently am working on, is talk with Dr. Saladin to see if in the Fall next semester or later this summer it’s still possible for me to work with him on the project. I absolutely despise leaving projects unfinished, and while my primary objective/deliverable- my map of Roman North Africa- is finished, there are plenty more projects as a whole for the website that I want to at least see finished, so I’ll certainly be working further if I’m allowed.

    I didn’t believe that I would reach the point where I was doing additional work after my deliverables were finished. However, I’m really happy that I was able to pick up the controls and basics of GIS and mapping to the point where I got another project after I was finished with my first one. What that project is, is a GIS Story Map ‘A Tour of Roman North Africa’, which will go through some of the major sites that Dr. Saladin visited, along with other important cities along North Africa for the Romans. I believe I will be able to have this finished by the end of the semester, and if not it will be only a small ways until it’s finished.

    https://storymaps.arcgis.com/stories/960cea187c2b4f6c8298c70825c5099c/edit

    The Story Map has seemingly ‘brought me back to my roots’ I like to say, as in I spent a week researching all of the sites I’ve decided to add into the Story Map. That is as a total almost 30 sites, and while I only needed at most 4-5 sentences per site, it was still odd to transition back to researching after weeks of strictly online work, however, that process only took a week and now it’s back online to finish the map. Dr. Saladin asked ‘what do we do next’, after I was finished up with my map draft, and I believe that is an important question to ask for any project like this, so I’m more then happy to finish out my internship hours helping with this.

    This is all in addition to the massive resume boost that this entire semester has brought me. I realized the importance this semester of networking and collaborating with others, ‘stepping outside my shell’ you could say. A year ago I never would have imagined attending events like Douglas Day, the Mapathon, let alone getting a job at the Penn Museum. Whether it was Emily helping me better learn about describing material culture to the public, learning more online skills with Dr. Saladin, or attending events and just sharing my progress during class meetings, I believe I wouldn’t have had the skills and resume necessary to get selected out of hundreds for a job like this.

    So, this summer after bringing history to the public digitally, I’ll be in the galleries of the Penn Museum leading tours, which is never something I thought I’d be able to do. And a large part of me being able to do that is thanks to the skills I achieved this semester.

  • The Map is done… now what?

    I never thought that I would be done the draft of my map by the midway point of the semester. I really thought that I would be working on it through the entirety of the semester. After the rough draft was done, I believed the ‘final draft’ would be more in depth on the map itself. However, what it actually is, according to Dr. Saladin, is essentially the question. I have a map, now what can we DO with it? I originally thought simply building the map was going to be enough, but no, now I get to go even deeper which is an exciting prospect. I’m saying that mostly because I get to finally indulge in more research centric work which I always believed I was much better at.

    https://rowanuniversity.maps.arcgis.com/apps/mapviewer/index.html?webmap=c98c7aaced084b5db2dfac236a59343c

    Essentially there were a few avenues to go down, and while I believe all of them will be explored eventually my next task comes down to using my map as a tool for a Story Map. I didn’t know that ArcGis also had a feature to make story maps, which is exciting because I have always loved doing story maps and already have experience making them. I decided in the end to do a ‘Tour of the Provinces’, in essence going between the different province boundaries in 117 CE, and going through the major cities of the five provinces. It won’t be extremely in-depth like a research paper, but a few facts and other details about the cities and each province. In addition to this, I’ll end up working in images to as many points on the map that I can, so if someone on the map wants to see pictures, they can follow the URL when they click on a point.

    I don’t estimate all of this taking me more then two-three weeks of dedicated work, and after that there are a few more things that Dr. Saladin mentioned we can do, including adding pictures he took himself at some of the sites mentioned through the Omeka website.

    This last week has taught me how important the question of ‘what’s next’ is to projects like this. It’s important to always be thinking about what else you can do with your project, and only when you finally don’t think there’s anymore you can do, do you finally sit back and say the job is done, but even then most of the time you end up thinking of more you could do down the line.

    In addition to all of this, it’s also helping me prepare for the future. My capstone project in the fall is something that has been in the back of my mind since I first heard about it. The plan is a map with the boundaries from the Sengoku Period of Japanese history, with points showing major battles from a recent database I found, and all of this is simply more and more skills to add into my resume so that I can make something great over the summer and in the fall.

  • Maps are hard

    In the last few weeks, I have really dug into the nitty gritty dregs of what it means to make a map. For example, I didn’t anticipate having to take almost three hours to simply add more data into it. On the map itself, I have two different layers on Roman North Africa. One that shows the borders that were drawn in the year 117 CE, and another set which were drawn in the year 303 CE. I only added these layers with boundaries only after I had set all my city points and hadn’t added the provinces on it. So, I was looking at a map with boundaries and cities, but on the label when you clicked a point you there wasn’t a label for the province in either of those years. I could have just gone back into the spreadsheet and replotted the points with the provinces labeled, however, I can’t see where each point is in the spreadsheet. So, as a result I had to click each individual point on the map-all 112- and manually enter the province for both sets of boundaries. I ran into ANOTHER problem after that, where while some of the points from my sources did have a province, they weren’t inside the correct border. This meant that I needed to cross reference and double check that I had the correct provinces in the databases I used to get the points in the first place. This is the kind of snag that I have come to realize is commonplace, and like today, can at times take me an entire day of working to get through. However, it was satisfying in the end now that I’ve finally completed it.

    https://rowanuniversity.maps.arcgis.com/apps/mapviewer/index.html?webmap=c98c7aaced084b5db2dfac236a59343c

    The idea of being a designer never crossed my mind for a moment, and I never considered myself someone artistically inclined. However, I’ve come to realize as well in the last few weeks, simple things like color design and the overall feel and look of making a map like this is making me think about design for the first time. Of course, I can’t just add points onto a map and call it a day, I have to fiddle with colors and fonts to labels along with the map itself, and that has really expanded my skillset as the weeks have gone on. That of course combined with me just becoming more and more proficient in using different kinds of software and web apps is going to be really useful going forward.

    In addition to all of the valuable skills that have come in the previous few weeks, being compensated for my time has really been one of the most rewarding things. I don’t count myself as a superficial person, but getting money in return for all my time and hardwork has made me even more motivated to do a great job. It really is nice getting a feel for how a future career can go for me. Now, at around the halfway point of the semester, I’ll soon finally get to move onto the next steps of the project, and finally be finished with this map.

  • Ground is Broken on the map

    So, after a few weeks of tedious data entry I’ve finally gotten to the point of actually making maps in ArcGIS online, and it has certainly been an eye opening experience. The sheer amount of options available in the software is extremely overwhelming. And then, coupled with the amount of information that I need to make sure is included in each data point is staggering. One thing that I noticed for the data table that I finished, is that some of the points like longitude and latitude have a hard time showing up in the table if I don’t have them formatted in a certain way.

    https://rowanuniversity.maps.arcgis.com/apps/mapviewer/index.html?webmap=c98c7aaced084b5db2dfac236a59343c

    If one is looking at the rough draft it may seem like most of the work is already done, however, I feel that I could still do weeks worth of work on it. I want to figure out how to remove the roman roads that aren’t specifically in North Africa and fix the display of the data points. However, I may also have to go back into the spreadsheet I created of all the roman cities and towns, in order to reorganize the data better, and figure out how it needs to be formatted in order to make all the data properly show up when the point is selected. I also need to better figure out how to use the Vector Tile Style Editor, which is used to create them. I understand the basic concept of its use, but the nuts and bolts of using it are still a bit confusing.

    https://rowanuniversity.maps.arcgis.com/apps/mapviewer/index.html?layers=fbffe10fd87c46ce837bdd5d65b66c30

    One of the more enlightening things about this last week, was the assigned reading “The Case For Bringing Experimental Learning into the Humanities.”. It starts out by highlighting the decline in conferred PhDs in the last few years which I have personally felt the sting of. I very much would have been interested in going for further education into a PhD track, but the amount of people accepted into University PhD programs is shrinking. I heard that Princeton is allowing as few as three into the History PhD track. The article gives the statistic of less than 1,000 PhDs given out in 2019, and this was then further shot down with the outbreak of Covid-19.

    This is followed up by the writers pointing out the growing skepticism of the relevance of humanistic studies for nonacademic career preparation. This is a frustrating thing to read as someone who for their entire schooling lifer had been in the Humanities, whether that be English or History. I remember distinctly being annoyed how I was made to take classes in science and math, however, I fully acknowledge the necessity of these in a well-rounded education. Humanities provides a similar function, it teaches you not only history, but debate, writing, discussion, collaboration, critical thinking, I can’t really imagine how it would be without some of the things that I learned.

    However, a majority of the reading is focused mainly the expansion of the job market and the new focus on “career diversity” that is going on in the field. I experienced things like this in every day life, when I tell people I major in history right away they say “Oh so you’re going to be a teacher?” and while it’s an innocent enough question, I simply don’t see myself being fulfilled as a teacher in the future for the next say twenty years. The idea a Humanities students going into simply teacher or researching, the article points out the skills many Universities are trying to highlight which include collaboration, communication, basic quantitative literacy, digital literacy, and intellectual self-confidence, which can all lead to more diverse careers.

    The highlight of more diverse skills that come with a Humanities degree is something that I’ve seen come to fruition as my internship this semester has progressed. From spending a week crafting spreadsheets of data, to my first time truly collaborating with a group, to the process of troubleshooting when using ArcGIS and figuring out how to get the desired look and effects on my maps. I’d even go as far as to say that I have a bit of an eye for design now after crafting the maps like I have. As the semester goes on, and I finish up my maps and projects, I fully expect this skill set and career options to expand even further.

  • A Taste of what’s to come…

    So, after twelve years of school plus six more in college, I’ve finally found myself getting paid to do historical work. It’s been every bit as rewarding as I was hoping that it would be, and I really hope that it continues in the future. It also isn’t what I expected it to be. It isn’t combing through old textbooks and writing papers, it’s entering data into spreadsheets, which has been strangely rewarding. Being able to do a majority of the work from the comfort of my own home has been one of the best parts, and ideally it could continue on into the future, but this is a great chance to not only expand my historical skills but others as well.

    My main goal for this semester is to expand on those other skills as well. For example, the last week has seen me doing a lot of data entry for the spreadsheet that includes the names of the cities in Roman occupied Carthage. My two primary deliverables this semester are a massive spreadsheet of the town names, populations, amenities, location, etc, and then a map of all these locations in Arc-GIS online. These two new skills, which are map making and data entry are things I want to expand on, since they open up new job opportunities in the future. They may not always have to do with history, but they’re still options which I want to have. I really want to keep my current tutorial maps, and then at the end of the semester look at the final map to really gage my progress. I spent the first two weeks of this internship strictly doing Arc-GIS online, using that and making basemaps.

    The first one I did during the tutorials was a map of all the Roman roads, forts, and cities of Roman occupied Britain. One of the coolest things that I was able to do was actually put the height of the forts and soldiers into the software, and it put a cone shape out on the map of all the area that someone patrolling the walls could see, giving you the same kind of view a Roman soldier on patrol would have had. On the other hand, I realized how quickly and efficiently I’m able to do data entry. Taking notes, names and populations from a recent study of the urbanization of Roman North Africa, I’ve been putting the spreadsheet together. However, one thing that I’m realizing is how much more intricate that this process is then I originally thought. Dr. Saladin in our first meeting showed me just how many more columns of data are going to be needed then I originally thought. For example, not only do I need a column with the citation from the book I drew from, but then one that lists the sources that book drew from as well. This is showing me how much more work is going into something as simple as a spreadsheet.

    One of the best benefits to this entire experience, is obviously being paid for it. It helps me feel so much more motivated to deliver a good product and do it on time as well. I really hope that this is a sign of things to come in the future, and that I can continue on with work like this in the future. That is what I primarily want to get out of this entire semester, the skills to move forward and continue in this line of work.